

Pie Chart DI for SSC CGL: A Pie Chart is one of the topics under the SSC CGL Quantitative Aptitude section. The Pie Chart for SSC CGL Quantitative Aptitude section consists of 4-6 questions weightage, and the level of questions appears in an easy to moderate form. Candidates can find the questions related to the Pie Chart DI for SSC CGL, which we have provided in both Hindi and English, at the candidate’s convenience. The questions that we have provided in the blog are the recommended questions, with the help of experts and by analyzing the previous year’s question paper. The SSC can present the different types of questions in the exams on a Pie Chart, so the candidates must solve the questions in different patterns to avoid mistakes in the Pie Chart DI for SSC CGL topic.

Pie Chart DI for SSC CGL: Topic-wise and Complete Preparation
Solving the topic test is very important if you want to get in-depth knowledge of the individual topic. Below, we have provided the topic tests for each section, including quizzes for current affairs, previous year question papers, and full-length mock tests.
| Click for Mock Test -> | SSC CGL Free Full-Length Mock Test |
| Click for SSC CA -> | SSC CGL Free Weekly Current Affairs Tests |
| Click for Quant -> | Quantitative Aptitude Free Topic Tests |
| Click for Reasoning -> | General Reasoning Free Topic Tests |
| Click for English -> | English Comprehension Free Topic Tests |
| Click for SSC GA -> | General Awareness Free Topic Tests |
| Click for Sectional Mock Tests -> | SSC CGL Free Sectional Mock Tests |
| Click for PYQs -> | Free SSC CGL Previous Year Question Papers |

Pie Chart DI For SSC CGL: Explanation
A Pie Chart DI can be explained as it is a type of chart that is represented in the form of a circle. The circle is further divided into slices to represent the numerical proportion. Each numerical portion or segment is proportional to the quantity it represents.
Pie Chart Important Formulas
There are two main formulas related to the Pie Chart provided below, candidates are advised to note them down in their formula notes for revision purposes during the last days of the exam.
Formulas:
1. To Draw a Pie Chart with a central angle:

2. To Draw a Pie Chart with Percentages

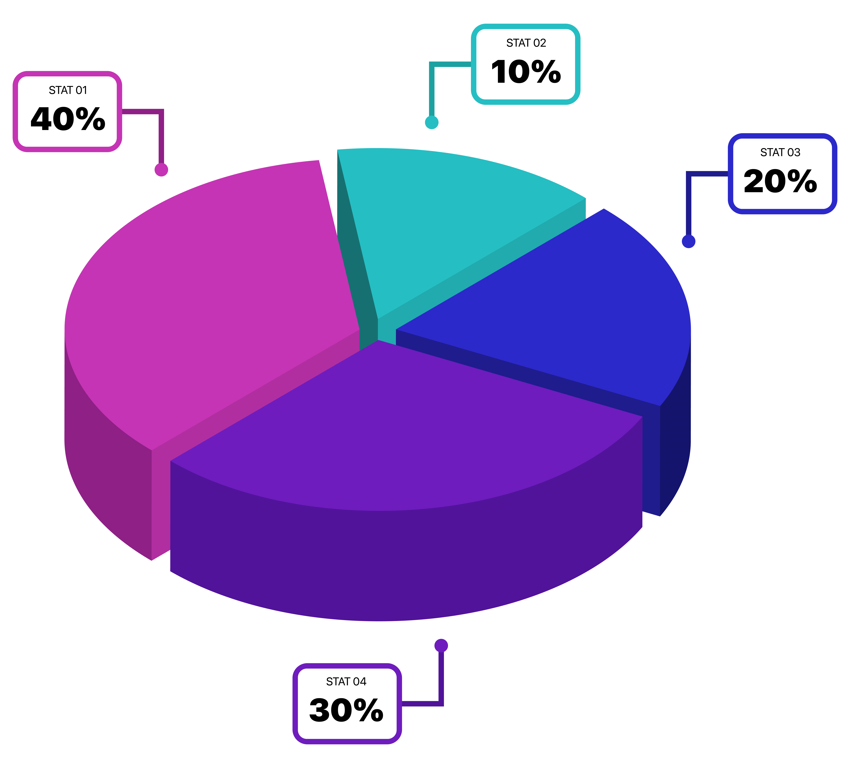
Representation of a Pie Chart
Here we have provided a Pie Chart diagram that shows how it looks.

Pie Chart DI Questions for SSC CGL, Download Free PDF
Candidates can find the Pie Chart DI questions for SSC CGL in this section. As for the candidate’s convenience, we have provided the pie chart questions in Hindi and English, both with their answers provided with explanations. Candidates are advised to try to solve the questions first and then see the explanations to analyze their preparation level on the topic.
Question 1: The given pie chart shows the percentage distribution of five different types of products sold.
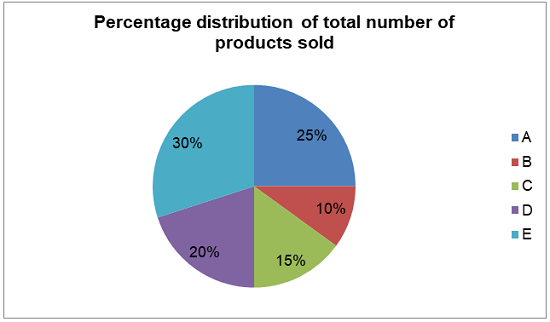
The number of product ‘D’ sold is how much percent more/less than the number of product ‘A’ sold?
A) 25%
B) 15%
C) 20%
D) 30%
Question 2: The given pie-chart shows the percentage distribution of number of cars sold of five different brands. The total number of cars of all the five brands sold is 24000.
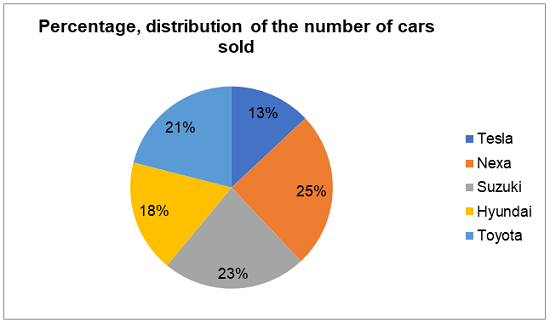
Find the sum of the number of Nexa’s cars sold and Toyota’s cars sold.
A) 10150
B) 13050
C) 12040
D) 11040
Question 3: The given pie-chart shows the percentage distribution of number of cars sold of five different brands. The total number of cars of all the five brands sold is 24000.

The number of Toyota’s cars sold is how much percent more/less than that of Hyundai’s cars?
A) 16.66%
B) 8.33%
C) 14.24%
D) 12.33%
Question 4: The given pie-chart shows the percentage distribution of number of cars sold of five different brands. The total number of cars of all the five brands sold is 24000.

The difference between the number of Suzuki’s car sold and Hyundai’s cars sold is same as the difference of number of cars sold of
A) Tesla and Toyota
B) Suzuki and Nexa
C) Hyundai and Tesla
D) Nexa and Toyota
Question 5: The given pie-chart shows the percentage distribution of number of cars sold of five different brands. The total number of cars of all the five brands sold is 24000.

Find the difference between the number of number Tesla’s cars sold and Toyota’s cars sold.
A) 2460
B) 1920
C) 1580
D) 1420
Question 6: The given pie-chart shows the degree distribution of number of students who like different subjects.
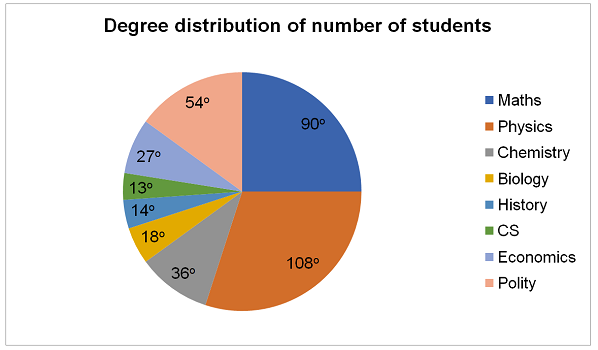
The number of students who like Maths exceeds the number of students who like Economics and Biology together by
A) 30%
B) 15%
C) 25%
D) 12.5%
Question 7: The given pie chart shows the percentage distribution of number of students in five different schools.
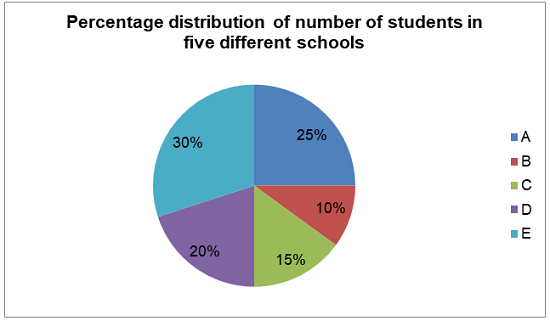
The number of students in school ‘D’ is how much percent more/less than the number of students in school ‘A’?
A) 25%
B) 15%
C) 20%
D) 30%
Question 8: The given pie-chart shows the degree distribution of number of students who like different subjects.

If the number of students who like Polity is 108, then find the number of students who like Chemistry.
A) 84
B) 56
C) 66
D) 72
Question 9: The given pie-chart shows the degree distribution of number of students who like different subjects.

What percent of students like Biology, History and CS together?
A) 12.5%
B) 15%
C) 10%
D) 18.5%
Question 10: The given pie-chart shows the degree distribution of number of students who like different subjects.

If total number of students is 2400, then find the average number of students who like Maths, Physics and Polity.
A) 580
B) 640
C) 560
D) 480
How to Prepare Pie Chart DI Questions for SSC CGL 2025 Exam?
Here we have provided the tips on how to prepare pie chart DI questions for SSC CGL 2025 exam.
- Understand the Basics of Pie Charts: First, understand what a pie chart is in data interpretation. The entire circle equals 360° (or 100%). Each sector’s angle or percentage represents part of the total.
- Know the Types of Questions Asked: The SSC may ask questions in which you will be required to apply percentages, angle concepts, ratios, etc.
- Practice Quick Calculations: Solving the pie chart questions for SSC CGL exam may be time-consuming, so practice as much as possible so that you can manage your time during the exam.
- Use the Elimination Method: Sometimes questions become easier to attempt when you eliminate some options that are not relevant by your smartness. To eliminate the options, use your logic and estimation.
- Solve PYQs and Attempt Mock Tests: Solve pie chart previous year questions to get an idea of question trends for SSC CGL exam and attempt timed mock tests. This will enable you to practice more effectively for the exam.

Join our exclusive Telegram group for expert guidance, personalized tips, and real-time solutions to boost your SSC exam prep. [Click here to join now!]
| Other Blogs of SSC CGL 2025 | |
| SSC CGL Notification | SSC CGL Syllabus |
| SSC CGL Study Plan | SSC CGL Exam Pattern |
| SSC CGL Cut Off | SSC CGL Preparation Strategy |
| SSC CGL Previous Year Question Papers | |
Pie Chart For SSC CGL FAQs
Yes, the level of the Pie Chart DI for SSC CGL is easy to moderate.
Candidates can expect 4-6 questions on the Pie Chart for SSC CGL.
A Pie Chart can be defined as it is the representation of data in a circular form. More details are provided in the blog.
You can find the Pie Chart questions in Hindi in the above blog.
- Sign Up on Practicemock for Updated Current Affairs, Topic Tests and Mini Mocks
- Sign Up Here to Download Free Study Material
Free Mock Tests for the Upcoming Exams
- IBPS PO Free Mock Test
- RBI Grade B Free Mock Test
- IBPS SO Free Mock Test
- NABARD Grade A Free Mock Test
- SSC CGL Free Mock Test
- IBPS Clerk Free Mock Test
- IBPS RRB PO Free Mock Test
- IBPS RRB Clerk Free Mock Test
- RRB NTPC Free Mock Test
- SSC MTS Free Mock Test
- SSC Strenographer Free Mock Test
- GATE Mechanical Free Mock Test
- GATE Civil Free Mock Test
- RRB ALP Free Mock Test
- SSC CPO Free Mock Test
- AFCAT Free Mock Test
- SEBI Grade A Free Mock Test
- IFSCA Grade A Free Mock Test
- RRB JE Free Mock Test
- Free Banking Live Test
- Free SSC Live Test